
Published: 31st August 2023
The Cycle Design Manual (CDM) has been prepared by the National Transport Authority (NTA) and overseen by the Department of Transport. It replaces the previous National Cycle Manual, published by the NTA in 2011, which is now withdrawn.
 The CDM draws on the experience of delivering cycling infrastructure across Ireland over the last decade, as well as learning from international best practice, and has been guided by the need to deliver safe cycle facilities for people of all ages and abilities.
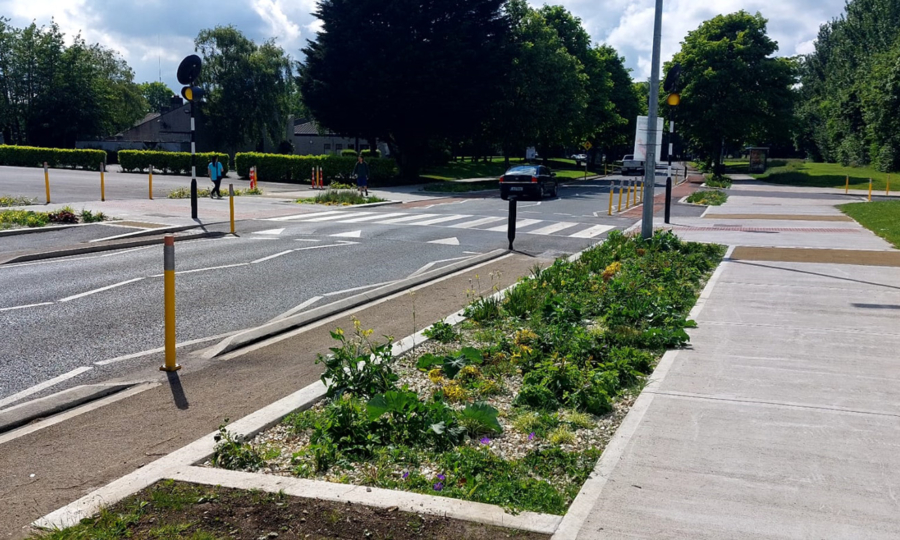
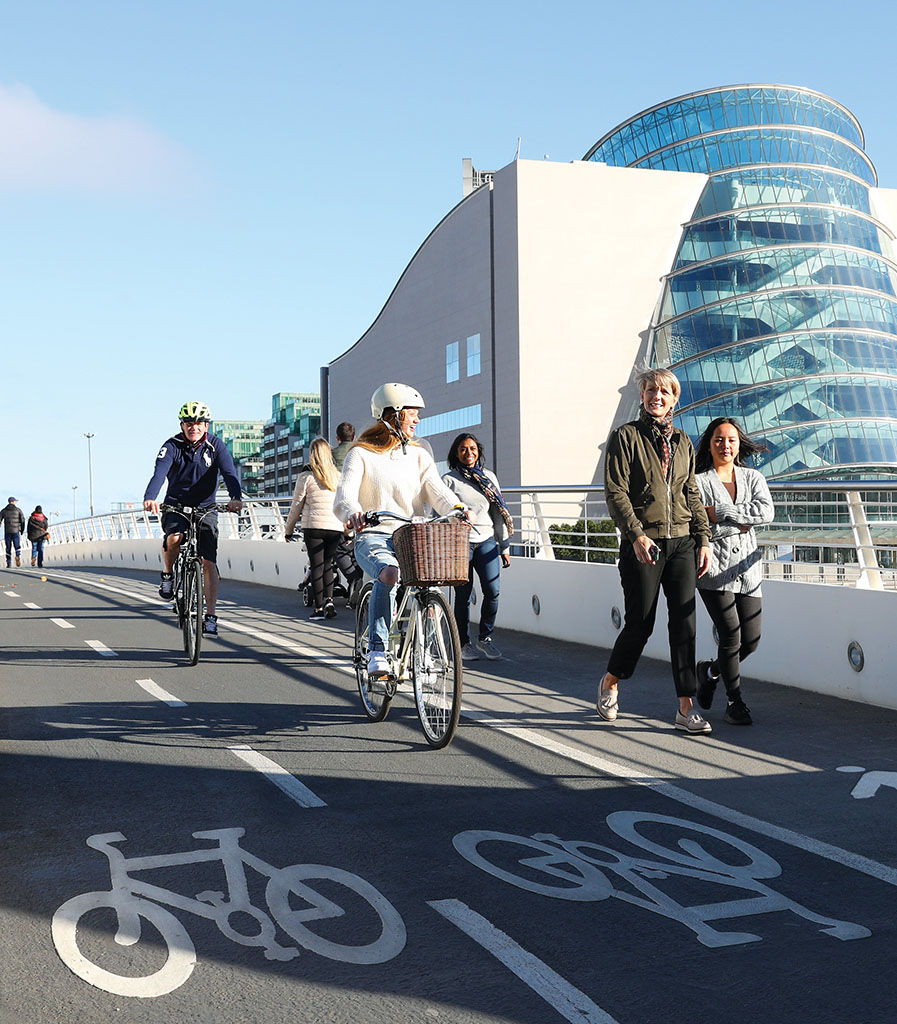
The new manual places more emphasis on the range of cycles that cycle infrastructure will have to accommodate and the recommendations focus on segregating cyclists from traffic where speeds and volumes make roads unsuitable for sharing. There is also a general presumption towards segregating pedestrians and cyclists where possible.
The CDM includes a number of new types of infrastructure such as protected junctions, Dutch style cycle-friendly roundabouts, and parallel crossings which are commonly used in other countries, and will now become an option for cycle infrastructure in Ireland. It should be noted that some newer features will require amendments to supporting Regulations and the Traffic Sign Manual so designers should consult with the relevant approving authority prior to installing any of the newer features to ensure applicability of designs/solutions.
It is intended that manual will be a live document which will be updated and expanded as required to reflect emerging best practice and feedback from user experience of the manual. For this reason, the latest version of the guidance should always be accessed through the NTA website.
Originally published 31st Aug 2023,
Page updated on 29th Nov 2023